How to Read Stock Charts: Understanding how to read stock charts is crucial for investors and traders looking to navigate the complex world of financial markets. Stock charts provide valuable insights into a company’s historical price movements, volume trends, and patterns, enabling investors to make informed decisions. In this article, we will delve into the key components of stock charts and provide a step-by-step guide on how to read them effectively.
I. Types of Stock Charts: There are several types of stock charts available, each offering unique information. The most commonly used charts include:
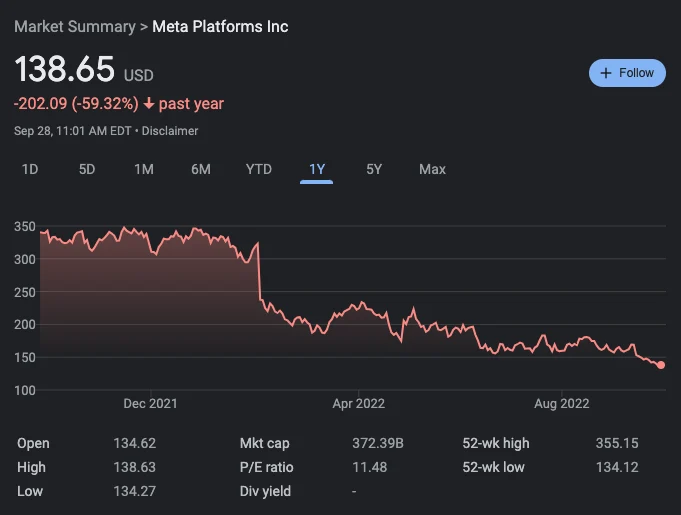
- Line Charts: Line charts are simple and visually appealing, depicting the closing prices of a stock over a given period. They provide a quick overview of a stock’s price trend.
- Bar Charts: Bar charts represent a stock’s price range over a specific time frame. Each bar displays the opening and closing prices as well as the high and low points. This chart type allows for a comprehensive analysis of price movements.
- Candlestick Charts: Candlestick charts provide a more detailed representation of price action. Each candlestick displays the opening, closing, high, and low prices. The body of the candlestick is colored to indicate whether the stock price increased or decreased during the period.
II. Key Components of Stock Charts: To interpret stock charts accurately, it’s essential to understand their key components:
- Price Scale: The vertical axis of a stock chart represents the price scale. It can be linear or logarithmic. Linear scales depict price changes proportionally, while logarithmic scales help visualize percentage changes.
- Time Scale: The horizontal axis of a stock chart represents the time scale. It can range from minutes to years, depending on the desired level of analysis. Common time frames include daily, weekly, and monthly.
- Volume: Stock charts often include a volume histogram at the bottom, representing the number of shares traded during each time period. Volume analysis helps determine the strength of a price movement and identify potential trends.
III. Analyzing Stock Chart Patterns: Stock charts reveal various patterns that can guide investment decisions. Some essential patterns to watch for are:
- Support and Resistance: Support levels indicate the price level at which a stock tends to find buying interest, preventing further decline. Resistance levels, on the other hand, represent price levels at which selling pressure typically increases. Identifying these levels helps determine optimal entry and exit points.
- Trend Lines: Trend lines connect consecutive higher lows in an uptrend or lower highs in a downtrend. They offer valuable insights into a stock’s overall trend and can act as dynamic support or resistance levels.
- Chart Patterns: Chart patterns, such as head and shoulders, double tops, and triangles, provide valuable signals about future price movements. These patterns are formed by price and volume fluctuations and are often indicative of trend reversals or continuations.
IV. Technical Indicators and Oscillators: In addition to basic chart analysis, investors can utilize technical indicators and oscillators to enhance their understanding of stock charts. Some popular ones include:
- Moving Averages: Moving averages smooth out price data, providing a clearer view of a stock’s trend. The 50-day and 200-day moving averages are widely used by traders to identify long-term trends.
- Relative Strength Index (RSI): The RSI measures the strength and speed of price movements on a scale of 0 to 100. It helps identify overbought or oversold conditions, indicating potential trend reversals.
- Moving Average Convergence Divergence (MACD): The MACD is a trend-following momentum indicator that compares two moving averages. It generates buy or sell signals when the moving averages cross each other.
Mastering the art of reading stock charts is a valuable skill for investors and traders alike. By understanding the different chart types, analyzing key components, and recognizing patterns and indicators, individuals can make informed decisions and maximize their chances of success in the financial markets. Remember, practice and continuous learning are essential for honing your chart reading skills and achieving long-term investment goals.
Read Also: Stock Market Volatility and Risk Management
![]()


One thought on “How to Read Stock Charts”